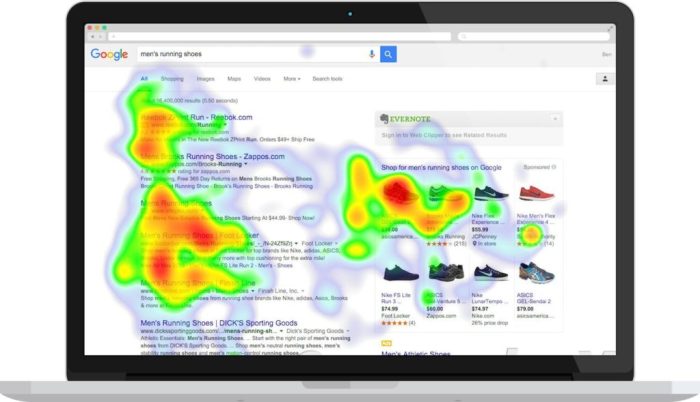
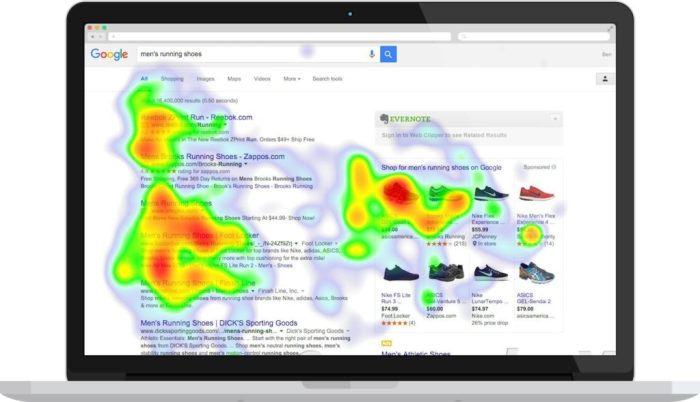
Understanding Website Heatmaps sets the stage for exploring the intricate world of user behavior analysis through visual data representation. Dive into the realm of website heatmaps to uncover hidden insights and trends that shape online interactions.
Discover how different heatmap types offer unique perspectives on user engagement and learn how to decode the colorful language of heatmaps to enhance your website strategy.
Introduction to Website Heatmaps: Understanding Website Heatmaps

Website heatmaps are tools used to visually represent user interactions on a webpage. They provide valuable insights into how visitors engage with a website, helping businesses optimize their design and content to improve user experience and conversion rates.
Types of Website Heatmaps
- Click Heatmaps: Show where users click the most on a webpage, indicating areas of interest or high engagement.
- Scroll Heatmaps: Display how far down a page users scroll, highlighting content visibility and areas that may need improvement.
- Move Heatmaps: Track mouse movement, revealing user attention and behavior patterns on a webpage.
Examples of Website Heatmap Use
Website heatmaps are commonly used for:
- Identifying popular areas on a page for placing important content or calls-to-action.
- Discovering user behavior patterns to improve website navigation and layout.
- Testing design changes and measuring their impact on user engagement.
Types of Website Heatmaps
When it comes to website heatmaps, there are different types that provide valuable insights into user behavior and interaction. Let’s explore the differences between click maps, scroll maps, hover maps, and attention maps.
Click Maps vs. Scroll Maps
Click maps and scroll maps are two common types of heatmaps that focus on different aspects of user engagement. Click maps show where users are clicking on a webpage, highlighting the areas that attract the most attention. On the other hand, scroll maps indicate how far down the page users are scrolling before losing interest. By analyzing both click and scroll maps, website owners can optimize their content layout and placement to improve user engagement and conversion rates.
Benefits of Using Hover Maps
Hover maps provide valuable insights into user behavior by tracking where users hover their cursors on a webpage. This type of heatmap can reveal areas of interest or confusion, helping website owners understand user intent and preferences. By analyzing hover maps, businesses can optimize their website design and content to enhance the overall user experience and drive conversions.
Attention Maps for User Engagement
Attention maps visually represent where users are focusing their attention on a webpage. By tracking eye movements and interactions, attention maps help in understanding user engagement and behavior patterns. These insights can be used to make informed decisions on website design, content placement, and call-to-action strategies to improve user engagement and conversion rates.
Interpreting Website Heatmaps

When it comes to interpreting website heatmaps, it’s all about understanding where users are focusing their attention and interactions on your site. Here’s how you can make sense of those colorful visual representations:
Understanding Hotspots, Understanding Website Heatmaps
Hotspots on a heatmap represent areas on your website that receive the most engagement from users. These are typically indicated by brighter colors, such as red or orange. By identifying these hotspots, you can determine which elements or sections of your website are attracting the most attention.
Significance of Color Gradients
Color gradients in heatmap analysis play a crucial role in highlighting the intensity of user interaction. Darker shades indicate low activity, while brighter colors signify high engagement. By paying attention to these color variations, you can quickly pinpoint areas that need improvement or optimization.
Identifying Patterns and Trends
To identify patterns and trends from website heatmaps, look for consistent behaviors among users. This could be recurring clicks on specific buttons, prolonged attention on certain content, or rapid scrolling through particular sections. By recognizing these patterns, you can tailor your website to better meet the needs and preferences of your audience.
Implementing Website Heatmaps
Implementing website heatmaps is crucial for gaining valuable insights into user behavior and optimizing website performance. The process involves integrating heatmap tools into the website, selecting the right tool for analysis, and utilizing best practices for effective use.
Integrating Heatmaps on a Website
To integrate heatmaps on a website, you need to first choose a reliable heatmap tool that suits your needs. Once you have selected the tool, follow the instructions provided by the tool provider to install the tracking code on your website. This code will collect data on user interactions and generate heatmaps for analysis.
Selecting the Right Heatmap Tool
Choosing the right heatmap tool is essential for accurate analysis. Consider factors such as the features offered, ease of use, compatibility with your website platform, and pricing. Some popular heatmap tools include Hotjar, Crazy Egg, and Mouseflow. Evaluate each tool based on your specific requirements before making a decision.
Best Practices for Utilizing Website Heatmaps Effectively
- Regularly review and analyze heatmap data to identify patterns and trends in user behavior.
- Use heatmaps in conjunction with other analytics tools to gain a comprehensive understanding of user interactions.
- Test different website elements, such as call-to-action buttons and navigation menus, to optimize user experience.
- Segment heatmap data based on user demographics or behavior to tailor website improvements to specific user groups.
- Share heatmap insights with your team to collaborate on website optimization strategies and decision-making.
